Quarter
Ending |
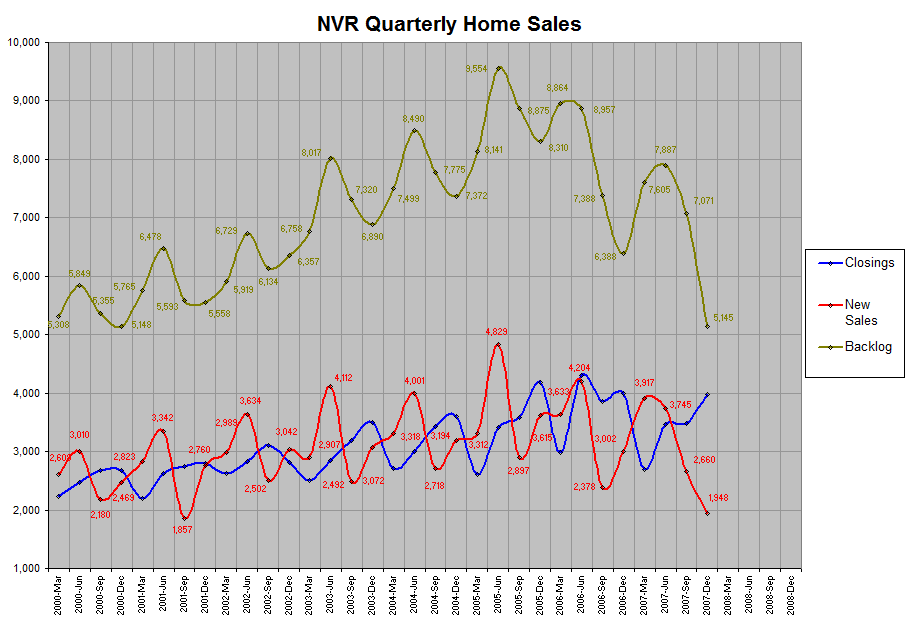
New Sales |
Closings |
Backlog |
| Units |
YOY |
Units |
YOY |
Units |
YOY |
| 2007-Dec |
1,948 |
-35.1% |
3,974 |
-0.7% |
5,145 |
-19.5% |
| 2007-Sep |
2,660 |
11.9% |
3,476 |
-9.8% |
7,071 |
-4.3% |
| 2007-Jun |
3,745 |
-10.9% |
3,463 |
-19.4% |
7,887 |
-11.0% |
| 2007-Mar |
3,917 |
7.8% |
2,700 |
-9.6% |
7,605 |
-15.1% |
| 2006-Dec |
3,002 |
-17.0% |
4,002 |
-4.3% |
6,388 |
-23.1% |
| 2006-Sep |
2,378 |
-17.9% |
3,854 |
7.8% |
7,388 |
-16.8% |
| 2006-Jun |
4,204 |
-12.9% |
4,297 |
25.8% |
8,864 |
-7.2% |
| 2006-Mar |
3,633 |
9.7% |
2,986 |
14.2% |
8,957 |
10.0% |
| 2005-Dec |
3,615 |
13.2% |
4,180 |
16.2% |
8,310 |
12.7% |
| 2005-Sep |
2,897 |
6.6% |
3,576 |
4.2% |
8,875 |
14.1% |
| 2005-Jun |
4,829 |
20.7% |
3,416 |
13.5% |
9,554 |
12.5% |
| 2005-Mar |
3,312 |
-0.2% |
2,615 |
-3.5% |
8,141 |
8.6% |
| 2004-Dec |
3,194 |
4.0% |
3,597 |
2.7% |
7,372 |
7.0% |
| 2004-Sep |
2,718 |
9.1% |
3,433 |
7.7% |
7,775 |
6.2% |
| 2004-Jun |
4,001 |
-2.7% |
3,010 |
5.5% |
8,490 |
5.9% |
| 2004-Mar |
3,318 |
14.1% |
2,709 |
8.1% |
7,499 |
11.0% |
Quarter
Ending |
New Sales |
Closings |
Backlog |
| Units |
YOY |
Units |
YOY |
Units |
YOY |
| 2003-Dec |
3,072 |
1.0% |
3,502 |
24.2% |
6,890 |
8.4% |
| 2003-Sep |
2,492 |
-0.4% |
3,189 |
3.0% |
7,320 |
19.3% |
| 2003-Jun |
4,112 |
13.2% |
2,853 |
1.0% |
8,017 |
19.1% |
| 2003-Mar |
2,907 |
-2.7% |
2,506 |
-4.6% |
6,758 |
14.2% |
| 2002-Dec |
3,042 |
10.2% |
2,819 |
0.9% |
6,357 |
14.4% |
| 2002-Sep |
2,502 |
34.7% |
3,097 |
12.9% |
6,134 |
9.7% |
| 2002-Jun |
3,634 |
8.7% |
2,824 |
7.4% |
6,729 |
3.9% |
| 2002-Mar |
2,989 |
5.9% |
2,628 |
19.1% |
5,919 |
2.7% |
| 2001-Dec |
2,760 |
11.8% |
2,795 |
4.4% |
5,558 |
8.0% |
| 2001-Sep |
1,857 |
-14.8% |
2,742 |
2.5% |
5,593 |
4.4% |
| 2001-Jun |
3,342 |
11.0% |
2,629 |
6.5% |
6,478 |
10.8% |
| 2001-Mar |
2,823 |
8.2% |
2,206 |
-1.3% |
5,765 |
8.6% |
| 2000-Dec |
2,469 |
NA |
2,676 |
NA |
5,148 |
NA |
| 2000-Sep |
2,180 |
NA |
2,674 |
NA |
5,355 |
NA |
| 2000-Jun |
3,010 |
NA |
2,469 |
NA |
5,849 |
NA |
| 2000-Mar |
2,609 |
NA |
2,236 |
NA |
5,308 |
NA |
|