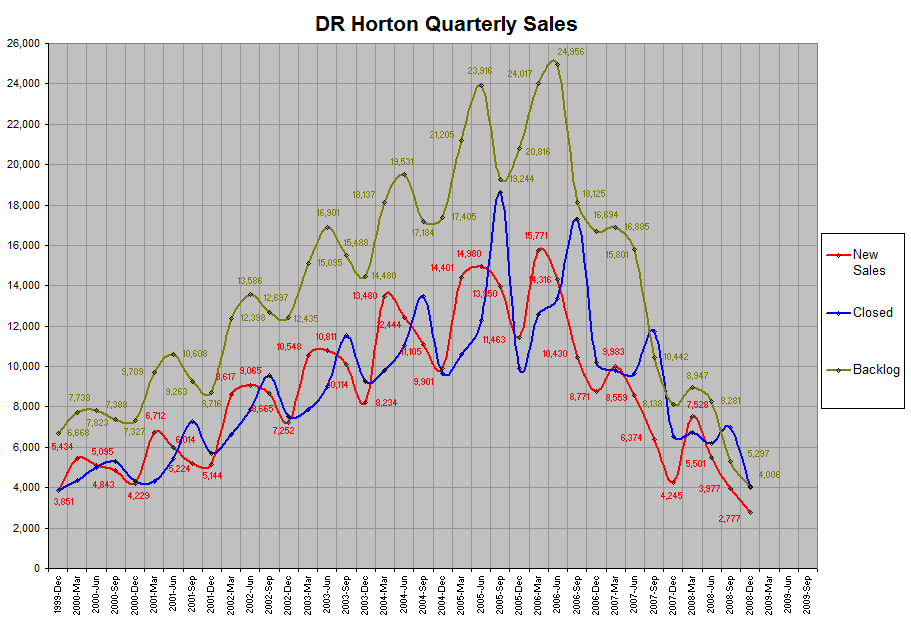
DR Horton Quarterly Sales

<< Back Home                                         Created : Jan 29, 2007
                                                *** Last Updated : Feb 11, 2009
            Legal Disclaimer : This is NOT investment advice. This information is already public,
                               and is presented here for information and entertainment purposes only.
                               Though double checked for accuracy, data entry errors are possible.
  Data obtained from

     DR Horton's News Releases

     Filings with the SEC


     D R Horton is ranked as
  No. 1 Builder in 2005, by
  number of deliveries.

     Backlog is the number homes
  under contract, but not yet
  delivered.
|
|
||||||||||||||||||||||||||||||||||||||||||||||||||||||||||||||||||||||||||||||||||||||||||||||||||
| Quarter Ending |
New Sales | Closings | Backlog | |||||||||
|---|---|---|---|---|---|---|---|---|---|---|---|---|
| Units | YOY | Dollar Value In Millions |
YOY | Units | YOY | Dollar Value In Millions |
YOY | Units | YOY | Dollar Value In Millions |
YOY | |
| 2008-Dec | 2,777 | -34.6% | 567.5 | -38.7% | 4,068 | -37.9% | 885.8 | -44.9% | 4,006 | -50.8% | 8,138.0 | 304.2% |
| 2008-Sep | 3,977 | -37.6% | 852 | -35.0% | 6,961 | -40.7% | 1,500.0 | -49.5% | 5,297 | -49.3% | 1,200.0 | -55.5% |
| 2008-Jun | 5,501 | -35.7% | 1,236.8 | -39.0% | 6,167 | -36.0% | 1,415.0 | -42.7% | 8,281 | -47.6% | 1,899.6 | -56.4% |
| 2008-Mar | 7,528 | -24.6% | 1,662.0 | -36.1% | 6,719 | -31.4% | 1,597.0 | -36.7% | 8,947 | -47.0% | 2,077.0 | -56.7% |
| 2007-Dec | 4,245 | -51.6% | 926.1 | -59.6% | 6,549 | -35.8% | 1,607.0 | -41.8% | 8,138 | -51.3% | 2,013.5 | -57.3% |
| 2007-Sep | 6,374 | -38.9% | 1,310.0 | -48.3% | 11,733 | -32.0% | 2,968.2 | -36.9% | 10,442 | -42.4% | 2,694.4 | -48.0% |
| 2007-Jun | 8,559 | -40.2% | 2,028.8 | -47.1% | 9,643 | -27.9% | 2,470.5 | -31.0% | 15,801 | -36.7% | 4,353.0 | -40.8% |
| 2007-Mar | 9,983 | -36.7% | 2,599.3 | -40.4% | 9,792 | -22.1% | 2,521.5 | -27.4% | 16,885 | -29.7% | 4,794.7 | -32.5% |
| 2006-Dec | 8,771 | -23.5% | 2,292.9 | -27.6% | 10,202 | 3.1% | 2,761.1 | -1.0% | 16,694 | -19.8% | 4,716.9 | -24.1% |
| Quarter Ending |
New Sales | Closings | Backlog | |||||||||
| Units | YOY | Dollar Value In Millions |
YOY | Units | YOY | Dollar Value In Millions |
YOY | Units | YOY | Dollar Value In Millions |
YOY | |
| 2006-Sep | 10,430 | -25.2% | 2,532.2 | -32.6% | 17,261 | -7.3% | 4,702.7 | -4.9% | 18,125 | -5.8% | 5,185.1 | -11.1% |
| 2006-Jun | 14,316 | -4.4% | 3,833.0 | -7.3% | 13,377 | 9.0% | 3,581.4 | 9.3% | 24,956 | 4.3% | 7,355.5 | 4.7% |
| 2006-Mar | 15,771 | 9.5% | 4,363.2 | 6.5% | 12,570 | 18.6% | 3,472.3 | 28.3% | 24,017 | 13.3% | 7,103.9 | 15.2% |
| 2005-Dec | 11,463 | 15.8% | 3,166.8 | 19.2% | 9,891 | 2.2% | 2,789.1 | 13.9% | 20,816 | 19.6% | 6,213.0 | 30.1% |
| 2005-Sep | 13,950 | 25.6% | 3,754.2 | 33.0% | 18,622 | 38.4% | 4,943.7 | 45.0% | 19,244 | 12.0% | 5,835.2 | 27.7% |
| 2005-Jun | 14,980 | 20.4% | 4,134.8 | 28.6% | 12,269 | 11.0% | 3,277.1 | 21.6% | 23,916 | 22.5% | 7,024.7 | 36.2% |
| 2005-Mar | 14,401 | 6.8% | 4,098.6 | 22.9% | 10,601 | 7.9% | 2,706.8 | 20.3% | 21,205 | 16.9% | 6,167.0 | 33.0% |
| 2004-Dec | 9,901 | 20.2% | 2,655.7 | 30.6% | 9,680 | 4.7% | 2,449.1 | 14.7% | 17,405 | 20.2% | 4,775.2 | 34.4% |
| 2004-Sep | 11,105 | 9.8% | 2,822.4 | 17.3% | 13,452 | 16.7% | 3,410.4 | 22.6% | 17,184 | 11.0% | 4,568.5 | 25.0% |
| 2004-Jun | 12,444 | 15.1% | 3,216.3 | 22.8% | 11,050 | 22.7% | 2,695.5 | 27.8% | 19,531 | 15.6% | 5,156.5 | 28.0% |
| 2004-Mar | 13,480 | 27.8% | 3,333.8 | 36.7% | 9,823 | 24.5% | 2,250.5 | 26.6% | 18,137 | 20.2% | 4,635.7 | 31.7% |
| 2003-Dec | 8,234 | 13.5% | 2,033.7 | 19.7% | 9,242 | 23.0% | 2,134.6 | 28.1% | 14,480 | 16.4% | 3,552.5 | 24.3% |
| Quarter Ending |
New Sales | Closings | Backlog | |||||||||
| Units | YOY | Dollar Value In Millions |
YOY | Units | YOY | Dollar Value In Millions |
YOY | Units | YOY | Dollar Value In Millions |
YOY | |
| 2003-Sep | 10,114 | 16.7% | 2,405.9 | 20.5% | 11,527 | 20.7% | 2,781.0 | 31.2% | 15,488 | 22.0% | 3,653.4 | 29.3% |
| 2003-Jun | 10,811 | 19.3% | 2,618.4 | 28.7% | 9,005 | 14.3% | 2,108.9 | 20.5% | 16,901 | 24.4% | 4,028.4 | 36.6% |
| 2003-Mar | 10,548 | 22.4% | 2,439.5 | 33.1% | 7,888 | 18.8% | 1,777.8 | 15.9% | 15,095 | 21.8% | 3,518.9 | 32.1% |
| 2002-Dec | 7,252 | 41.0% | 1,698.5 | 66.3% | 7,514 | 32.0% | 1,666.4 | 48.0% | 12,435 | 42.7% | 2,857.3 | 56.2% |
| 2002-Sep | 8,665 | 65.9% | 1,996.5 | 93.5% | 9,554 | 31.2% | 2,119.3 | 42.2% | 12,697 | 37.1% | 2,825.2 | 46.1% |
| 2002-Jun | 9,065 | 50.7% | 2,034.6 | 67.5% | 7,877 | 44.1% | 1,750.2 | 60.5% | 13,586 | 28.1% | 2,948.2 | 30.4% |
| 2002-Mar | 8,617 | 28.4% | 1,833.4 | 35.2% | 6,639 | 53.3% | 1,534.4 | 79.8% | 12,398 | 27.7% | 2,663.7 | 27.9% |
| 2001-Dec | 5,144 | 21.6% | 1,021.4 | 13.5% | 5,691 | 32.7% | 1,125.7 | 31.5% | 8,716 | 19.0% | 1,829.5 | 15.7% |
| 2001-Sep | 5,224 | 7.9% | 1,031.9 | 7.8% | 7,284 | 38.0% | 1,489.9 | 48.6% | 9,263 | 25.4% | 1,933.8 | 25.8% |
| 2001-Jun | 6,014 | 18.0% | 1,214.5 | 21.3% | 5,467 | 9.1% | 1,090.2 | 17.1% | 10,608 | 35.6% | 2,261.4 | 42.9% |
| 2001-Mar | 6,712 | 23.5% | 1,355.9 | 36.3% | 4,330 | -0.8% | 853.6 | 9.4% | 9,709 | 25.5% | 2,083.3 | 37.8% |
| 2000-Dec | 4,229 | 9.8% | 900.3 | 24.6% | 4,290 | 11.4% | 856.1 | 18.5% | 7,327 | 9.9% | 1,581.1 | 22.0% |
| 2000-Sep | 4,843 | NA | 957.5 | NA | 5,278 | NA | 1,002.8 | NA | 7,388 | NA | 1,536.9 | NA |
| 2000-Jun | 5,095 | NA | 1,001.6 | NA | 5,010 | NA | 930.8 | NA | 7,823 | NA | 1,582.2 | NA |
| 2000-Mar | 5,434 | NA | 995.0 | NA | 4,364 | NA | 780.1 | NA | 7,738 | NA | 1,511.4 | NA |
| 1999-Dec | 3,851 | NA | 722.3 | NA | 3,851 | NA | 722.3 | NA | 6,668 | NA | 1,296.5 | NA |
______________________________________________________________________________

Copyright © 2006 by Author. This material may be distributed only subject
to the terms and conditions set forth in the Open Publication License.