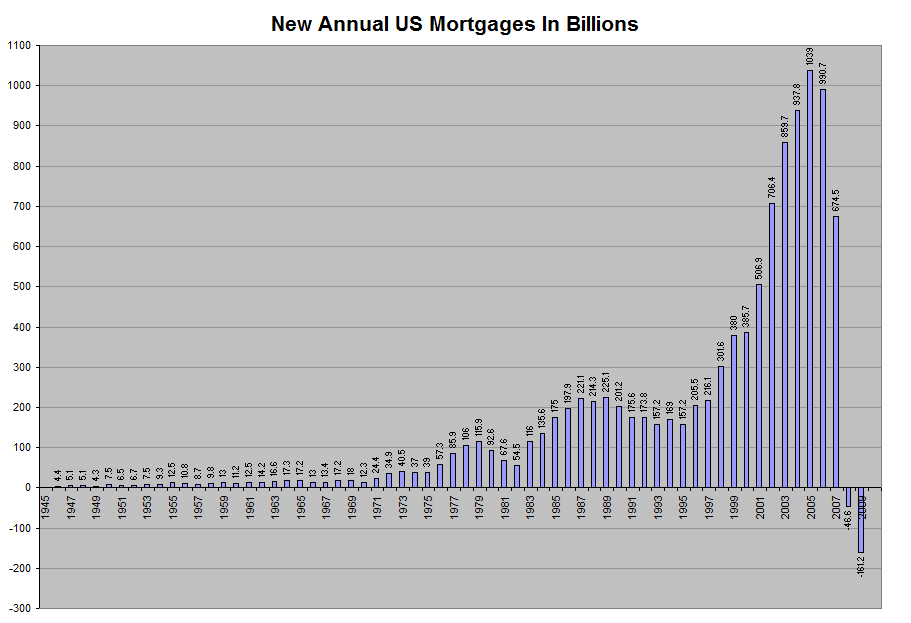
The Federal Reserve publishes the Annual Flow of Funds Accounts.
This Historic Data contains information about New Home Mortgage
loans taken out every year.
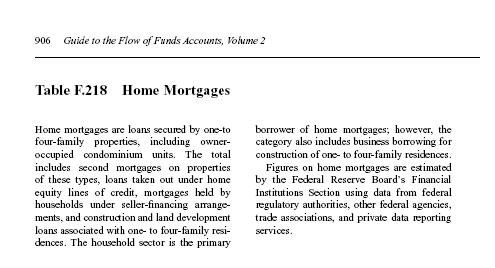
This information is contained in line 2 of F.218 Home Mortgages (1).
| Year |
Mortgages |
Year |
Mortgages |
Year |
Mortgages |
Year |
Mortgages |
| 1945 |
NA |
1965 |
17.2 |
1985 |
175.0 |
2005 |
1039 |
| 1946 |
4.4 |
1966 |
13.0 |
1986 |
197.9 |
2006 |
990.7 |
| 1947 |
5.1 |
1967 |
13.4 |
1987 |
221.1 |
2007 |
674.5 |
| 1948 |
5.1 |
1968 |
17.2 |
1988 |
214.3 |
2008 |
-46.6 |
| 1949 |
4.3 |
1969 |
18.0 |
1989 |
225.1 |
2009 |
-161.2 |
| 1950 |
7.5 |
1970 |
12.3 |
1990 |
201.2 |
2010 |
- |
| 1951 |
6.5 |
1971 |
24.4 |
1991 |
175.6 |
2011 |
- |
| 1952 |
6.7 |
1972 |
34.9 |
1992 |
173.8 |
2012 |
- |
| 1953 |
7.5 |
1973 |
40.5 |
1993 |
157.2 |
2013 |
- |
| 1954 |
9.3 |
1974 |
37.0 |
1994 |
169.0 |
2014 |
- |
| 1955 |
12.5 |
1975 |
39.0 |
1995 |
157.2 |
2015 |
- |
| 1956 |
10.8 |
1976 |
57.3 |
1996 |
210.1 |
2016 |
- |
| 1957 |
8.7 |
1977 |
85.9 |
1997 |
223.3 |
2017 |
- |
| 1958 |
9.8 |
1978 |
106.0 |
1998 |
304.2 |
2018 |
- |
| 1959 |
13.0 |
1979 |
115.9 |
1999 |
376.6 |
2019 |
- |
| 1960 |
11.2 |
1980 |
92.6 |
2000 |
366.5 |
2020 |
- |
| 1961 |
12.5 |
1981 |
67.6 |
2001 |
464.5 |
2021 |
- |
| 1962 |
14.2 |
1982 |
54.5 |
2002 |
635.5 |
2022 |
- |
| 1963 |
16.6 |
1983 |
116.0 |
2003 |
741.0 |
2023 |
- |
| 1964 |
17.3 |
1984 |
135.6 |
2004 |
878.6 |
2024 |
- |
|